Using a AAAA major league + winter major league to develop fringe prospects
I haven’t blogged about Out of the Park baseball in a long time, but I figure relying on forums and other places for information sharing when I just keep it on my blog is good, not like anyone is reading this anyway.
The problem with OOTP is that it’s not great at modeling development of those AAAA players or young prospects with a lot of potential who can’t get enough reps or simply aren’t developing in your traditional minor league ecosystem. In my current save which is an old template from when OOTP still had all of the world leagues, I have created (in 2041) a 3rd major league (Federal League) that is surely a step below the majors, but is better than AAA.
It’s good for veterans who are benchwarmers looking to start, solid players do well but don’t tear it up, and best of all, prospects who haven’t managed to thrive are able to get meaningful major league at-bats and develop their on their potential.
One other tactic I’ve done for years and have implemented is a winter international league that runs November-March, as a way to give guys more reps. I know this happens IRL where major leaguers will go to Latin America and play winter baseball, but OOTP doesn’t have those leagues natively, so I just create a international league that’s tailored to paying guys major league-ish salaries for the off-season.
It’s a good way to give free agents who might want to sign better deals a chance to prove themselves, and while I don’t manage a team currently, if I were managing a team, it’d be a way for me to Commish mode a guy into a loan with a winter league team to get more reps before he comes back to us having gotten more work in.
I’ve just started this model in my current save, so I’m still waiting to see what test cases come out as guys who were languishing and become stars because of this setup, but the early evidence is promising.
Why the pricing out of youth sports so personal
The NYTimes opinion story today on youth sports being a multi-billion dollar industry that prices out poor, urban & rural kids is indeed a personal one to me. I reflect a lot on my own childhood experience learning to play tennis in public programs that were low cost or no cost to participants. This access enabled me a relatively low risk to try something that no one in my family had any real context for, because we didn’t know anyone who had previously played tennis save for randomly picking up a racket and playing at the park with a friend.
While eventually now looks back as though my tennis playing was some kind of accepted thing, it wasn’t and my parents were afraid it was going to be expensive and that I wouldn’t stick with it. It turns out 1) it was not expensive and 2) I did stick with it. It wasn’t only access to coaching, it was the prolifteraton of programs that included year-round playing that also helped tennis stick. This was around the same time the internet started to really bubble up and even with tennis, marching band, and whatever school activities I participated in, I still managed to make all sorts of far-flung friends online arond the same time.
Without getting me out of the house in tennis, I feel like I’d have spent more time on the computer and less time outside engaging with people I’d never have gotten to know otherwise. The other thing is, tennis literally helped me move away from home, at different times of life it supplemented my income and helped me adapt in new communities. None of this would’ve been possible had things gone differently. I’m not of the opinion that all kids need sports, cultural activities like music and a wide range of other activities are a good balance for young people to discover themselves, learn how to practice and perform and grow confidence. Working together and being part of a team — whether it’s a play, a band, or simply helping put something together — is such an invaluable part of growing up.
The fact we’ve stopped investing in these areas of life makes me sad, because everywhere in the country, activity fees proliferate increasingly strapped school districts who attempt to do more with less. This pain is felt through booster clubs who supplement, volunteers who invest their time and kids themselves who sacrifice to play the games they love with their friends. It’s just sad to me that we’ve decided to take this approach to youth activities in a single generation.
8 Arenas of Action Matrix
- Complicated: For situations that require expertise, bring in knowledgeable people to create detailed plans and make sure everyone can follow them.
- Complex: If the situation is unpredictable, use regular feedback from a diverse group to make decisions and look out for unexpected changes.
- Chaos: When everything is a mess, sometimes you have to rely on luck or make a complete overhaul.
- Aporetic: When you’re stuck between two difficult options, set up teams to explore different solutions in simulations.
- Clear: When things are straightforward and well-understood, just follow standard processes and watch out for anyone breaking the rules.
- Complex-Chaos: To prepare for emergencies, develop and test networks that can sense human behavior, and use simulations to train.
- Liminally Complicated: Use strategic foresight in advance and prepare for the unexpected, including those who don’t fit the normal patterns.
- Unimaginable: Sometimes things happen that you just can’t predict or prepare for.
Assessing the worthiness of posting in the AI era
Social media being disconnected thanks to the demise of Twitter remains something I think about a lot. I’m also wondering about the value of “posting” at all. For the posting addled among us, looking for ways to get our (posting) fix remains a constant need. Whether it’s using nuTwitter, Threads, Bluesky, Mastodon or some other wild alternative. For many early adopters, the blog era was a transformative time. In the era where words are cheap and might not be written by you at all, it’s difficult to imagine the value of investing in third-party platforms.
It depends on the goal. Are we writing to riff? Are the ideas throwing into the ether, begging for engagement or a way to generative ideas outside of your own head? It’s probably not that deep. I like a good long-form story. Documentaries are favorites of mine, but I’m not going to read even a reddit post that seems like it might be written by an AI. I think LLMs are mostly a scourge, but I’ve also come to understand how they could be utilized productively. So much of social media usage was about expanding networks beyond where you live, work or play. It’s not that it’s impossible to do this with LLMs, bots have been around a while. The extra work required to sift through the noise just makes everything worse to use.
I reflect a lot on whether it’s worth continuing to post — even as I do it — because the habit is difficult to break, and there are brief moments where it feels like “old times.” But so many good ideas get trapped onto networks we don’t own, forgotten about and/or lost. Even bookmarks can be difficult to dredge, and hundreds of other people’s good ideas get deleted and forgotten without a second thought, because all of this stuff is fleeting.
On social media platforms & separation of concerns
Twitter’s demise has brought a variety of imposters aiming to give users a semblance of what we had for years. Twitter’s magic had less to do with the platform itself, but rather, the people who found themselves there. For instance, you could have multifacted conversations in real time with different people around different topics. Twitter was like the sports bar, tech conference hallway conversatons & professional post-work gathering all at once. At its peak, it enabled academics, comedians & regular people to engage and connect in ways that weren’t possible at the same velocity. This isn’t a celebratory post, since social media has wrought far more than it delivered, but like any tool it’s about how you use it, not about the tool itself.
Not to double down too heavily on a metaphor, but the concept of ‘separation of concerns’ is a design principle focused on the distinctive sections of software. For instance, the separation of HTML, CSS and Javascript. When I think about separation of concerns in the context of social media platforms, it’s a bit different but related.
The nicest thing that the web 2.0 offered aspirants who had some other interesting thing to share, was the chance to get out of their own networks and into new spaces. Moving to a new city gives you a chance at reinvention, the same way that a new job can do. The stories about people in the pre-internet age who would leave home one day, turn up in a new city with a new name and family, having left their own one behind is essentially what platforms like Tumblr and Twitter did in the form of user names.
I remember when an internet personality who had a huge following from a forum community and eventually on Twitter passed away. His family had no idea about his other life and they raised thousands of dollars for a kid he’d left behind, and they were overcome by how many lives he’d touched through his internet antics over the years, they just knew him as the person he was and that was it. It’s so gratifying to see how many public scholars leveraged this era to grow massive followings, sell books, and transform their lives from backbenchers in Faculty Senate to global icons. The pathways to the public square is always full of gatekeepers, but being able to amplify your work to larger audiences, through consistency, is one of the most powerful parts of the demise of Web 2.0
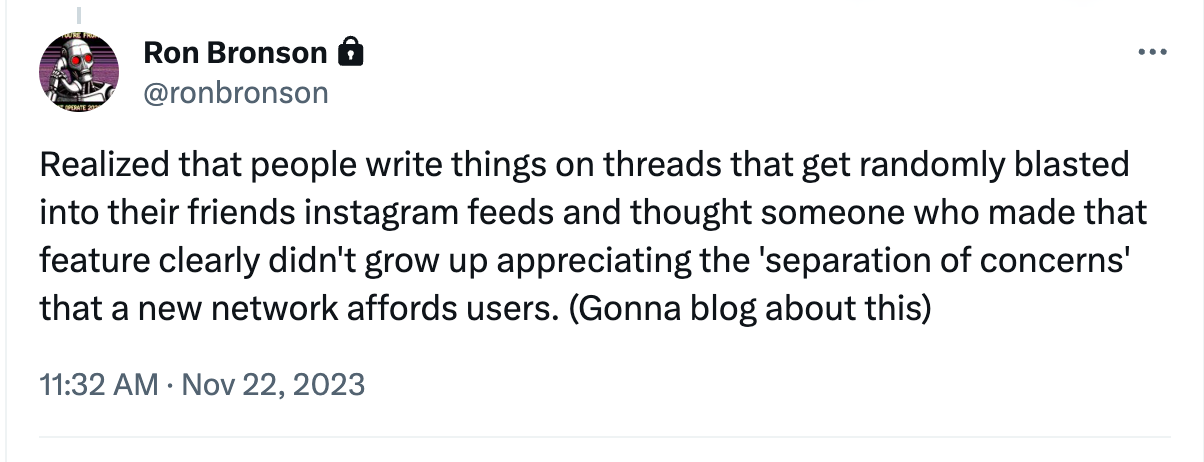
This brings me back to separation of concerns and the original premise of this post. Facebook’s twitter clone “Threads” (via Instagram) has a feature that blasts Threads posts of your instagram followers into the instagram feed. This is an understanding growth nudge aimed at creating FOMO for any instagram laggards who refuse to jump on the Threads train, as it’s normie Twitter vibes continue to grow in the most anodine ways.
Besides the growth hacking reasons for feeding your users complimentary app content, it’s not user friendly. Casual posters might appreciate these nudges, as it might get their friends to engage with them on a new platform. But the beauty and joy of older social media was meeting people you’d never get to reach out to.
Celebrities hawking their newest sponcon were never the reason anybody signed up for Myspace, created a blog on Tumblr or spent hours on Twitter. You showed up because there wasn’t anyone in your immediate orbit to share your wacky ideas about random Star Trek episodes with, or to livereact to a TV show that’s in Season 1 and not popular enough for your friends to care about.
Beyond identity layer cakes, old school platforms scored wins by connecting people across interests and scenes accidentally. On Tumblr or Twitter, even your weirdest takes could find true fans and new BFFs. Knowing at least one wonderfully weird someone would embrace your eccentricities made scrolling forever feeds irresistible.
At its heart, old school web’s network domination was people connecting through shared weirdness and words, not code or cash. As platforms trade online/IRL separation and welcoming weirdos for digital dollars and attention, can today’s social giants resist turning vibrant human connection into metrics on a spreadsheet? I think there’s magic to be found elsewhere online — and in real life — and the platform age will continue to erode, having already lost of the magic of what made the original eras great.
Why we ought to be (civil) cartographers, not “experience” designers
Civil Cartography rejects the notion that designers can be jacks-of-all-trades overnight. Just taking a workshop on “design thinking” doesn’t magically impart deep knowledge from other fields. This isn’t about inflating the role of designers alone either. It’s about mapping invisible structures through collaboration.
For too long, designers have focused obsessively on pixels and aesthetics, rather than leveraging their skills to shape policy and impact at scale, often because they don’t have the context or backgrounds to contribute. Civil Cartography begins with designers building practical connections between speculative futures, user experiences, and the intricacies of how our world operates.
It brings experts from across domains together to speculate, theorize, critique, and act in unified ways. Civil Cartography takes abstract concepts out of academic silos and into the streets, shelters, and community centers that comprise our shared spaces. It grounds big ideas in on-the-ground realities.
We aim to push big thinkers to roll up their sleeves, to engage directly with communities, and illuminate the nuances that make society work, especially for those most vulnerable. Civil Cartography also strives to equip policymakers and leaders with deeper literacy of how technologies transform the social fabric, so they can govern digital spaces responsibly.
Technologists alone cannot solve immense societal challenges. We need multi-disciplinary collaboration and a shared grasp of the fault lines underlying injustice. Civil Cartography provides a discourse beyond siloed “engineering” or “architecture” - one that situates design and technology firmly in their human impacts.
In short, Civil Cartography re-envisions design’s role not as stylizing, but as collaboratively mapping a more just, equitable society. We draw lines that connect, making visible the invisible structures that dictate how we live together. Our shared objective is a future that benefits us all.
Let’s face it - fancy job titles like “strategist” or “systems thinker” sound impressive but don’t really say much. Sometimes design gets so bogged down in jargon and aesthetics that it loses sight of its real purpose - making a genuine difference in people’s lives.
That’s where “Civil Cartography” comes in. It’s all about creating design that connects to the real world - not just pretty screens and interfaces. I’m talking policy, community needs, the very structures we rely on each day. For a Civil Cartographer, design gets out from behind the computer and into the nitty gritty of improving how things work. It’s recognizing that design can reshape the policies, programs, and infrastructure that shape our society, if we let it.
Design conversations are too cloistered. There’s too much stuff hidden in journals that can be helpful, but that no one sees. Civil Cartography means jumping into the muddy trenches where real life happens. Engaging directly with communities, seeing what they need, designing based on what works for them rather than abstract theories.
With tech and physical life meshing more than ever, we also have to guide policymakers on how it’s transforming society down to its roots. Translate complex tech speak so they can make informed decisions. We’re the ones who get to help upgrade the policies that govern digital space and real space alike. This goes beyond slapping labels like “engineer” or “architect” on designers. It’s about being “Civil Cartographers” who understand the whole interconnected landscape and our role in charting a better course. Modern problems require a fresh perspective.
In short, Civil Cartography reimagines whatever “human-centered design” role in the world used to be. It’s about using our skills to map out a future that’s imagines something tangible. We all draw lines - Civil Cartographers make sure they lead somewhere that benefits us all.